
Although Generative AI is making headlines every day, it is still a new concept to most people. Furthermore, Data Generative AI (DGA) is even less well known, so many of the people I talk to struggle to understand when it makes sense to make use of it. In this post, I’ll give a quick synopsis of what DGA is, then walk through some requirements you’ll need to have in order to implement it.
What is Data Generative AI?
Many people have recently become aware of the power of generative AI by looking at Chat-GPT. This is a system that has been trained using large language sets and can create written responses to written queries. DGA, in contrast, creates written reports out of large data sets. It analyzes the data, figures out what is most important/interesting and writes out its analysis in an easy-to-read narrative. In essence, Chat-GPT and other Large Language Models (LLMs) go from language 🡪 language, while DGA systems go from data 🡪 language.
In theory, this opens up all data sets to automatic AI analysis and reporting. In practice, there are technical and economic reasons that the current use of DGA can only be applied to certain kinds of data sets.
The five things you’ll need to make use of DGA are:
Accessible Data
The first step that a DGA system takes when building a report is to ingest data. Since one of the main goals of using DGA is to automate reporting processes, it figures that the process of ingesting data has to be completely automatic as well. This means that you’ll need to have some way of automatically delivering your data to a DGA system. Typically, this means setting up an API with a private authentication key to allow the DGA to pull down data. However, there are other methods as well, such as sharing a flat file or giving access to an online spreadsheet such as Google Sheets or Office 365. If security is a concern, it could even be possible to build the DGA system using a sample data set and then transfer the program onto your servers so it could run without the data ever leaving your organization.
The good news is that while you might need to create a new access point for your data, you will rarely need to change the format or structure of how your data is stored. This is because all of the data coming into a DGA system needs to be manually placed into a conceptual hierarchy. This process takes the same amount of time whether you have one API with all of your information in JSON format, or 10 different data silos with a mix of formats. In fact, one of the great benefits of DGA is the ability to pull in information from anywhere and make it all understandable and accessible.
Structured Data
Accessing the data is only part of the equation, however. The other key requirement is that the critical data you want to analyze is ‘structured’ data. Determining what counts as ‘structured’ data is a bit tricky, so let’s go over an example. Here is a simple spreadsheet of stock data:
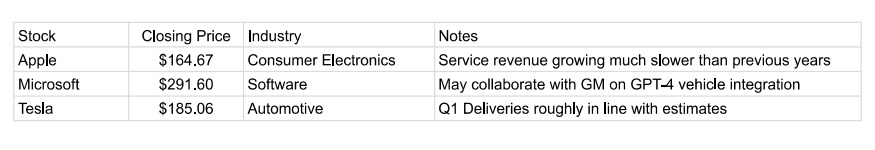
In this example, “Closing Price” is a perfectly structured piece of data. It has a clearly definable metric (Closing Price) that is represented by a number. This makes it really easy for DGA systems to work with it. Slightly less structured is the data in the “Industry” column. In this case, you have a text value that corresponds to all possible industries. Whether a variable like this would be considered structured or not typically comes down to: (1) how it will be used, and (2) how many different text options exist. If it is just as simple as having the system assign an ‘industry’ value to each company and group it with other companies that have that same industry, then this can be pretty easy. But imagine if there were 100 different industry types. In that case, you might want to assign each company a higher-level organizational value (like a ‘sector’) that comprises many industries. This might need to be set up manually as part of the data ingestion process. Furthermore, if you have many possible text values it’s likely that some of them might need spelling or grammar intelligence attached to them (such as whether they are singular or plural).
Looking at the "Name" column, we see an example of text-based information that is minimally structured for data purposes, but can be effectively used for labeling. You can’t use this text to derive substantive information about the company, but you can simply insert it into the narrative. Again, there might be complications with data like this because of grammatical issues.
Finally, we get to the ‘Notes’ column. Sentence and paragraph length text is the least structured data. Of course, the ability of AI to structure text is improving all the time. Things like sentiment analysis or word clouds can be effective ways to structure that data and integrate it into the narrative. In general, though, DGAI is called Data Generative AI for a reason, and so if any critical information is found in long-form text it is probably not a great candidate to get automated.

Complicated Input
You are generally going to need a lot of data to justify setting up a DGA system for the simple reason that if you don’t have a lot of information then you probably don’t need an automated system to analyze and synthesize it. Essentially, DGA is great at solving data-overwhelm, but that means you need an overwhelming amount of data.
Most of you reading this have probably already skipped to the next section, saying something along the lines of “yeah, having too little data is not my problem.” But, for those of you unsure if you have enough (and to get the wheels turning for the rest of you) it’s good to think about just how many different ways there are to have an ‘overwhelming’ amount of data.
Having a long sequence of data over time can easily make for a difficult analysis, particularly if placing the values of the current time period (such as this month’s sales data) into historic context is important. Another way that complexity can occur is due to the interaction of groups. For instance, imagine a single retail sale that occurs. That sale occurred in a particular location (that might have many levels- city, state, country, etc.), for a particular product (that might have a color, style, category, department, etc.), and sold to a particular person (that might have demographic information, sales channel info, marketing tracking info, etc.). All of these individual pieces of information might have interesting interactions, and the number of possible combinations can add up quickly.
Complicated Output
While you might have a lot of data, there is also the question of what type of reporting you need to derive from that data? It’s possible to have a tremendous amount of data that can be crunched down to just a few key metrics. In that case, you need algorithms that look through the data and crunch the numbers, but you don’t need DGA. DGA is used for synthesis, in situations where there are lots of things that are potentially interesting, but you want a story about just the most important ones.
Let’s illustrate this point using a football game. When the Dallas Cowboys play the New York Giants, a tremendous amount of data is generated. There is the play-by-play of the game, the total stats for each team, the total stats for each player, the history of the stats for each team and player, the upcoming schedule, the previous matchups between the two teams, and many more! Clearly, this amount of data satisfies the ‘complicated input’ requirement.
But let’s say that you only care about one thing- ‘who won the game?’. In that case, you don’t need a synthesis from DGA, since even though there was a huge number of things that happened, they can all be boiled down to the final score. But what if your question is ‘what happened in the game?’ In that case, you need DGA to parachute in and examine thousands of possible storylines and organize and write up just the most important ones. DGA works great in situations where thousands of things could happen, hundreds of things did happen, but you just want to read about the 10-15 most important events.
This example is also a good illustration of the importance of a narrative in telling a story. Modern dashboards are usually the equivalent of a ‘box score’ for a sporting event. It’s certainly interesting sometimes to go through a box score, but most people would much rather read a story about what happened in the game than read through the numbers and try to figure out what happened on their own.
Scale
DGA has to ingest data from your unique data sources, organize it into a conceptual hierarchy, create compelling content from it, and then format and deliver that content to particular end points. Unfortunately, all this takes a decent amount of up-front effort. That means that DGA doesn’t make a lot of sense unless you have a lot of reports you need built. Exactly how many reports depends on the value of each one, but it would typically be at least 1,000 over the course of a year (numbers of 1,000,000+ per year are not uncommon).
Often, people will ask me about automating a particularly onerous report within their organization that someone on their team has to put together every month. Unfortunately, if a report takes half of one employee’s time, that usually means that: (1) we’re not providing much value if we automate it, and (2) that report is really long and complicated, making it extra expensive to build out.
Instead, think about using DGA when you:
Or some combination of the three

You Can Do It!
Hopefully this guide gives you a good sense of exactly what you need to be a good candidate to apply DGA to your data sets. If your use case satisfies all five requirements then you can bask in the power of being able to create beautiful, insightful reports as often and at whatever scale you choose.